Interface and Application Programming
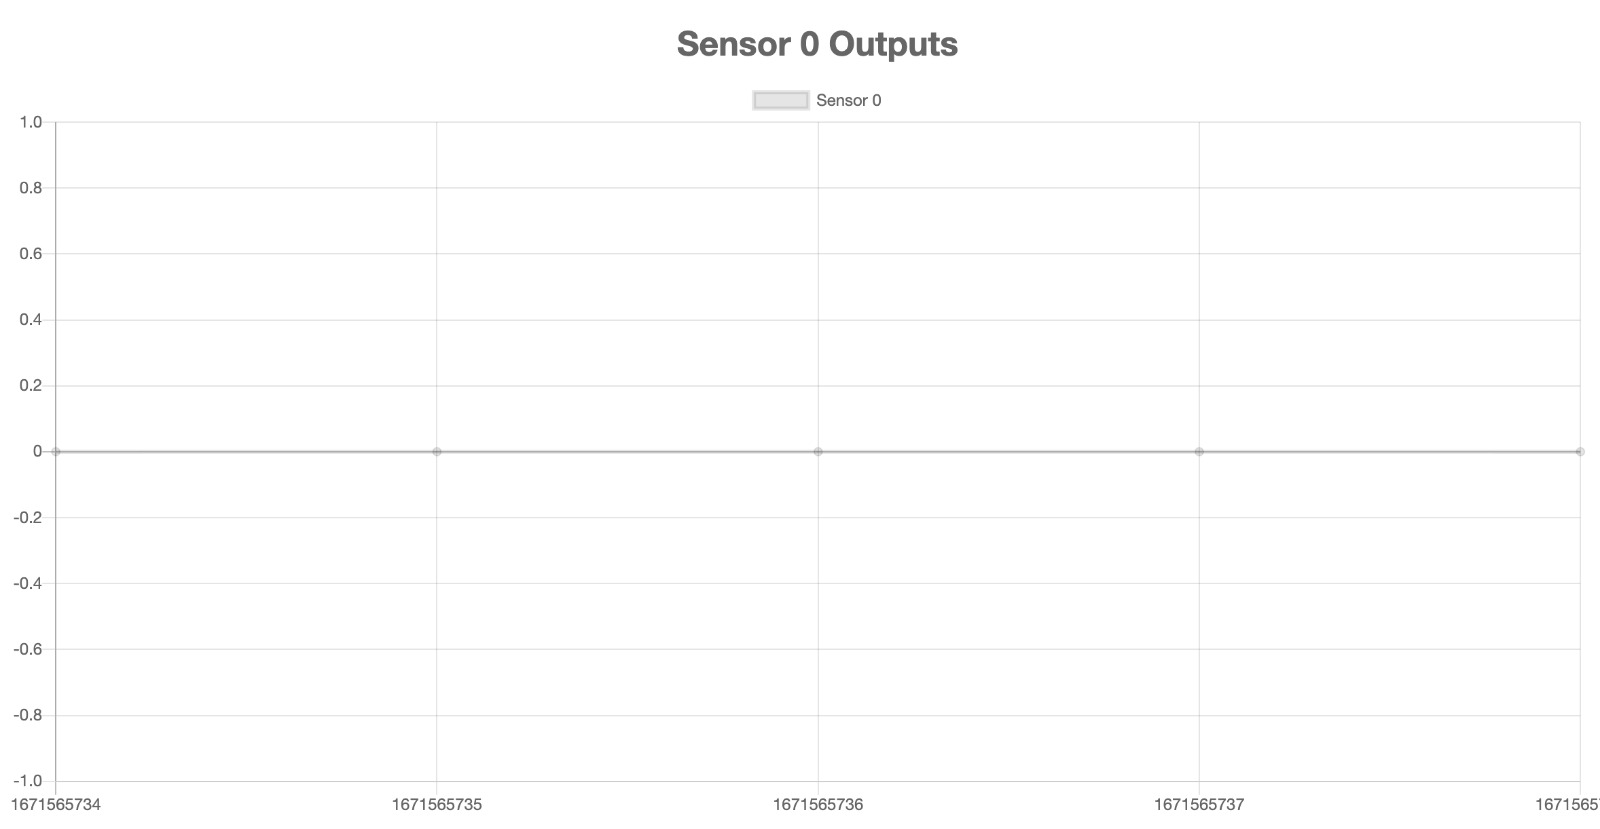
This week I am going to build on last weeks work. This week I am going to make an application to see the differt sensor values. I am going to be helped by using this guide. I am going to be changing my Data Collection script such that we can visualize the data. In week 10 I had changed the firebase from a website and read it using the arduino, this week I am sending data to firebase from arduino then reading from the website. The visualization will be using Chart.js which is an open source javascript library for data visualization. Each of the sensors will have its own line graph where the x-axis is the time of recording and the y-axis is the analog output of the sensors.Chart.js
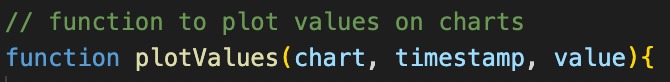
A couple challenges I was running into was how and when to add the the graphs, and how to get the time which the sensors were running. I also wanted to use good object oriented programming proinciples. This means that I am going to have functions to do the work of the program then one loop that is running the functions when needed.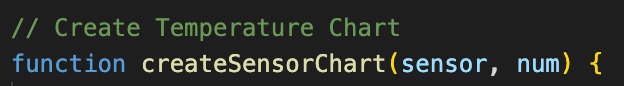
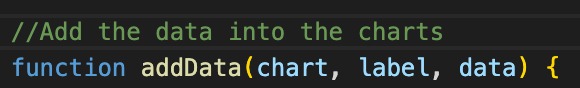
The arduino is sending the data from the sensors to a the database under the child of the userID. The javascript program is looking for the changes the specific users database and then adding that the graph.
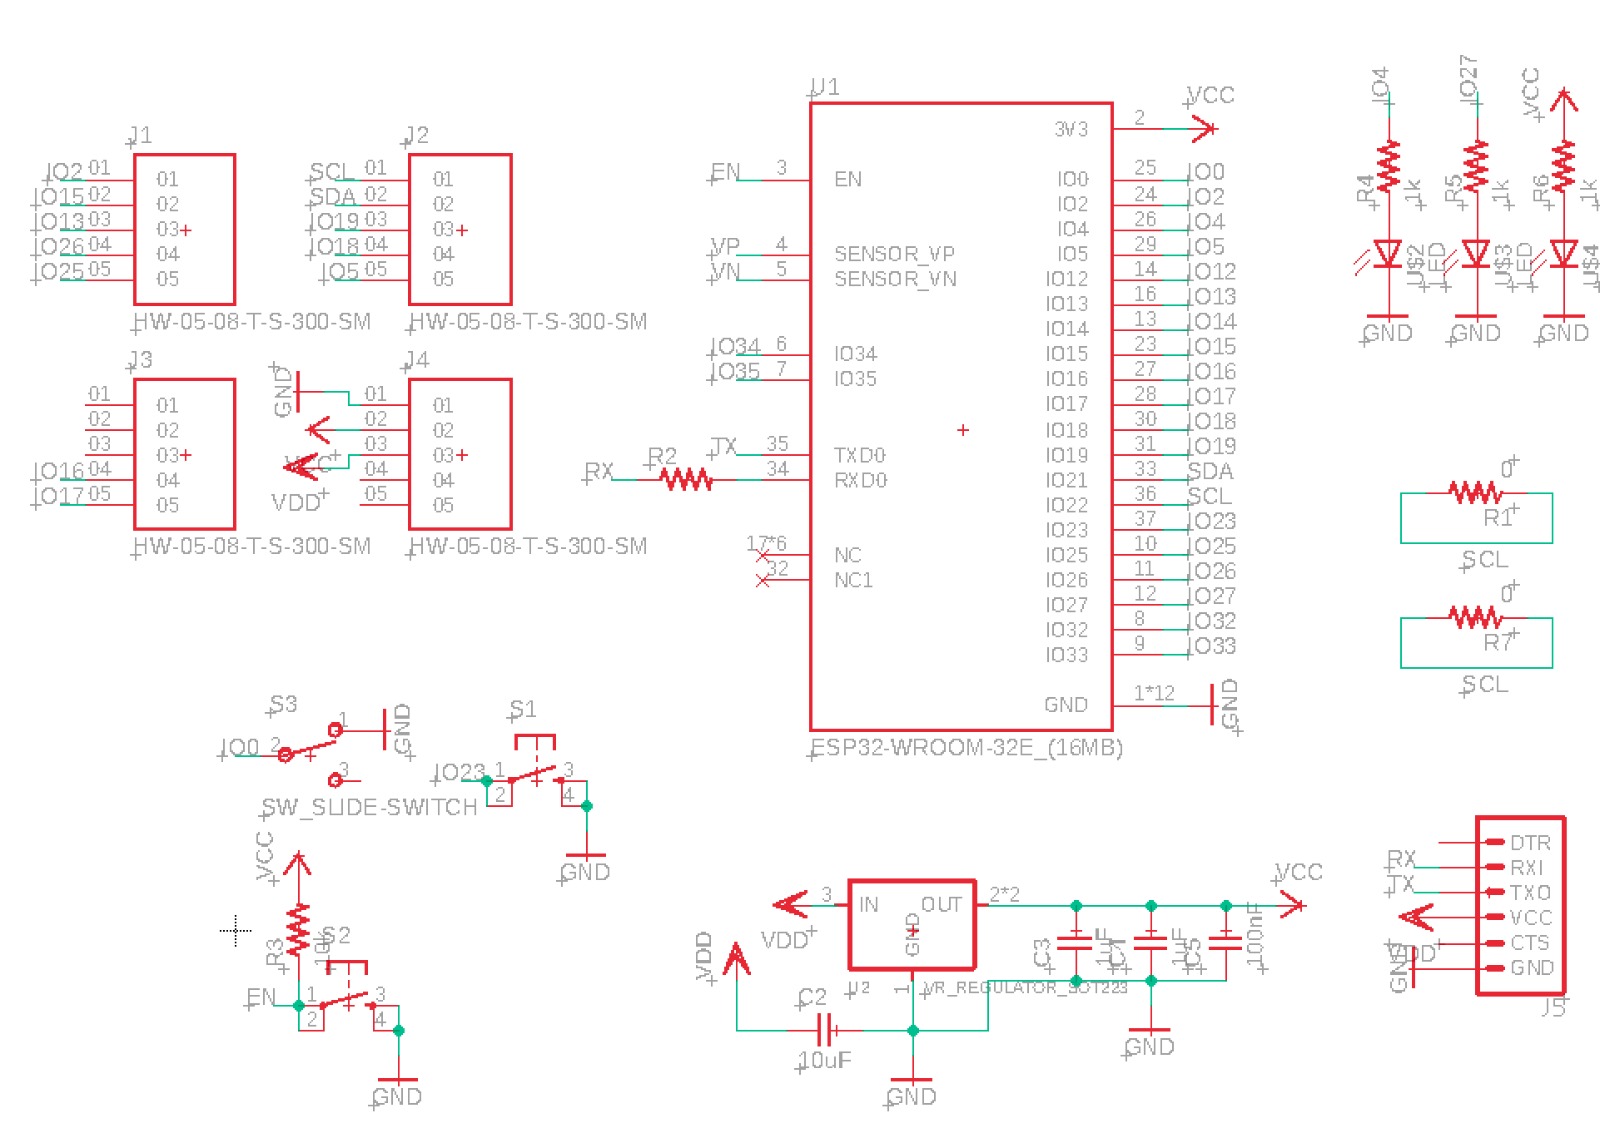
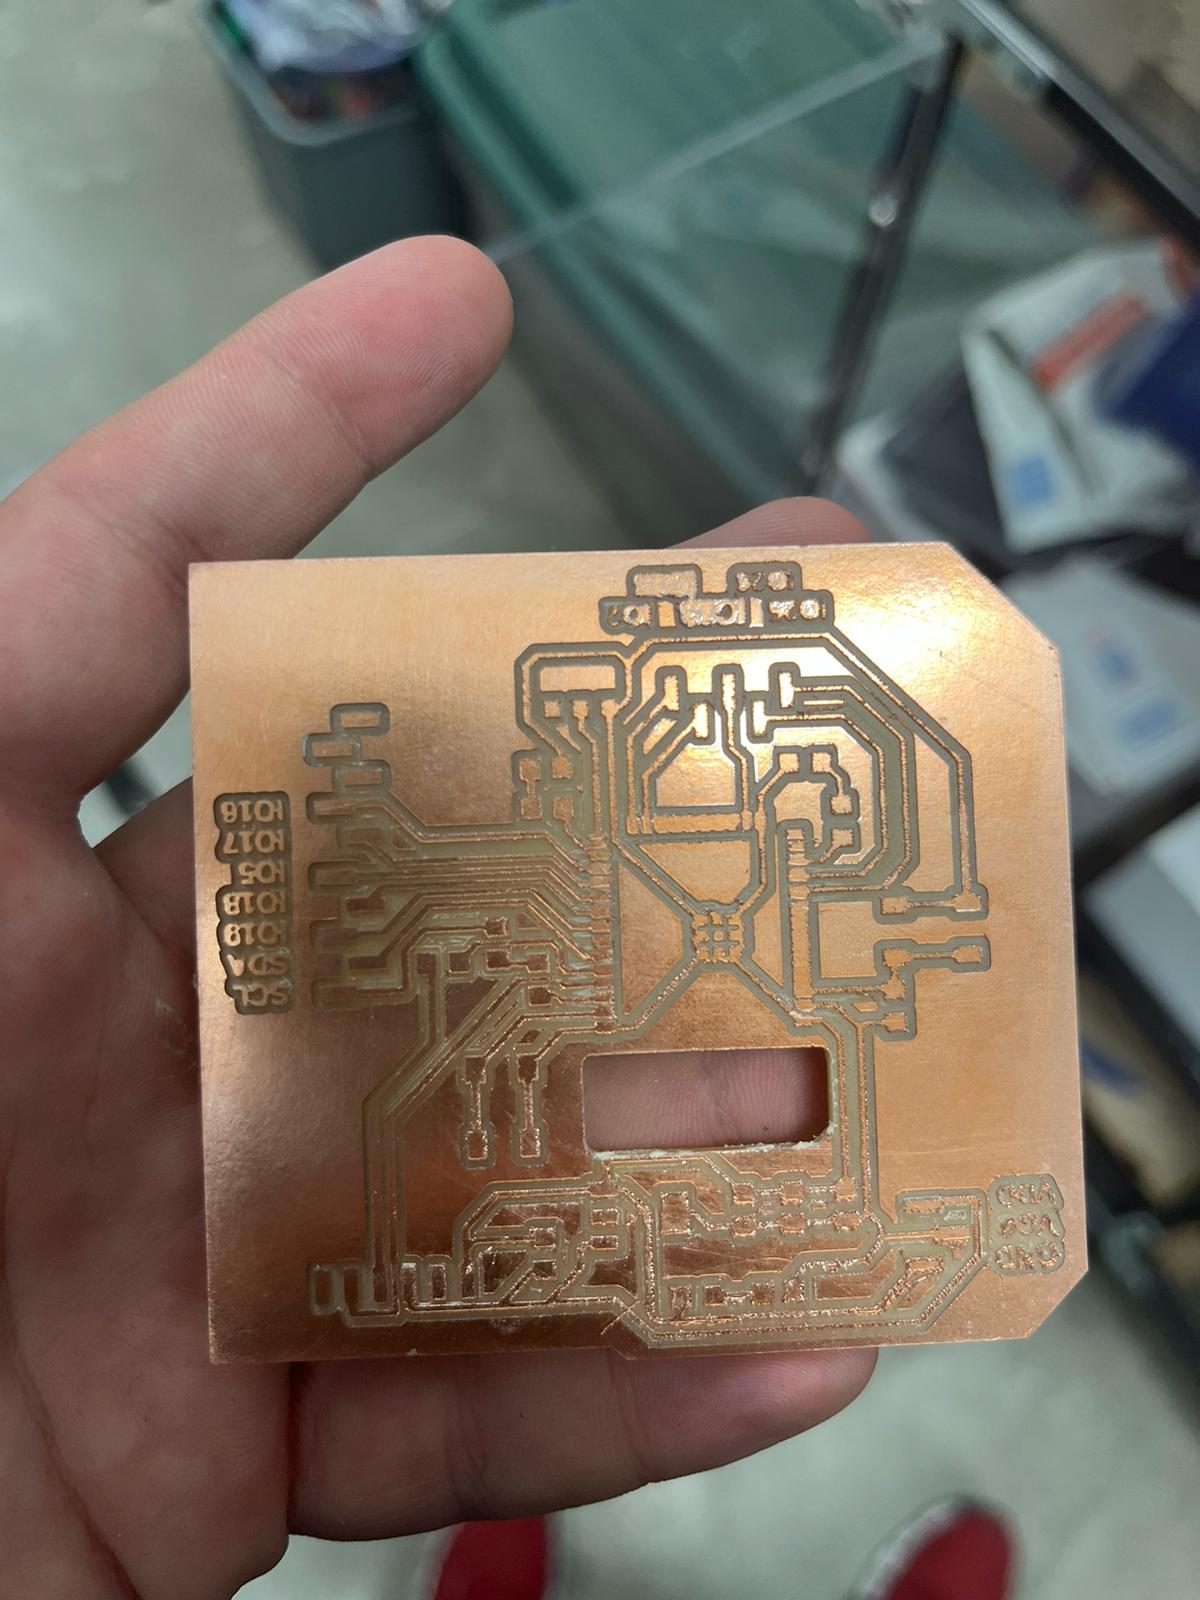
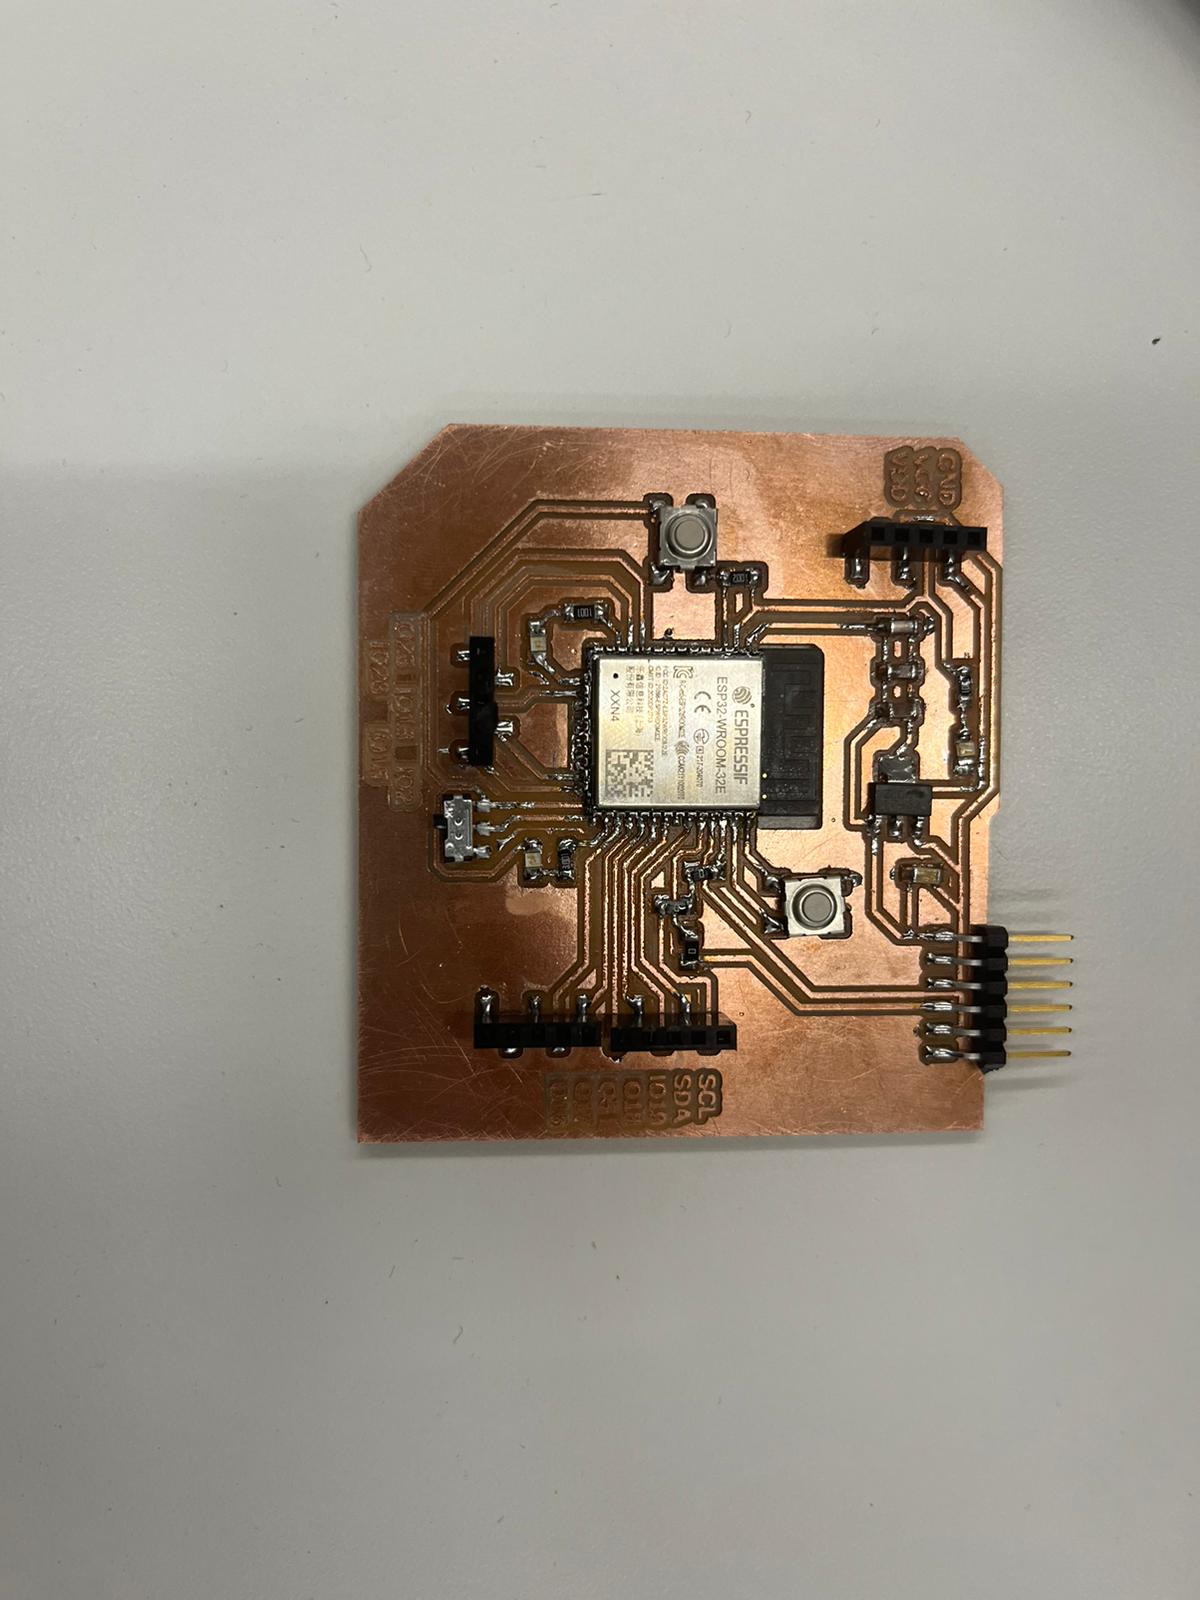
ESP32 Dev Board
During this week I also worked on my ESP32 Dev Board to run my final project. This took a couple of tries and a lot of time looking at the ESP32 documentation. I was looking a lot at Treydan's website because he has a good week of using and making a board using the ESP32 chip. After making the scematic and board design.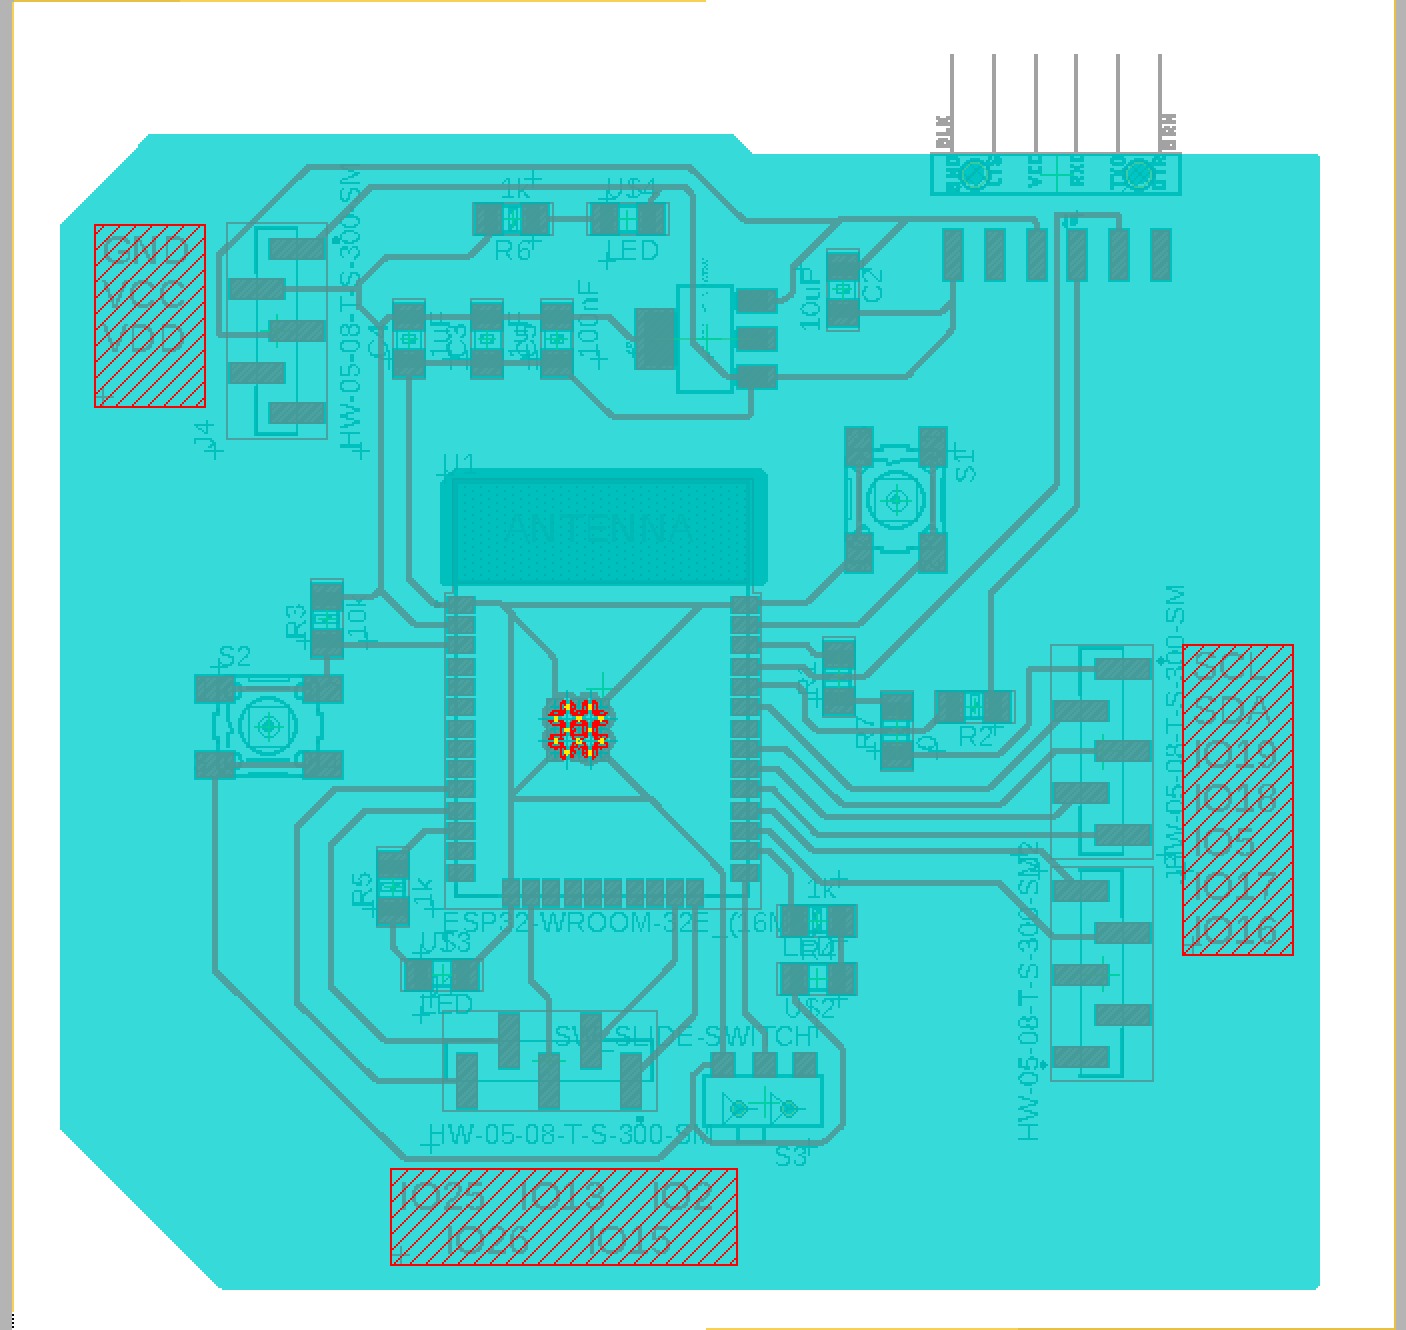
Resources
- Guide for Real-time data loggin Page
- Tut part 2 Tutorial
- Helpful resource for adding and updating data
- Helpful resource for authentication
- Helpful resource for graphing